Observability
Observability for agentic AI goes beyond traditional APM. You need visibility into LLM calls, tool invocations, reasoning chains, token costs, and output quality — not just latency and error rates.
Overview
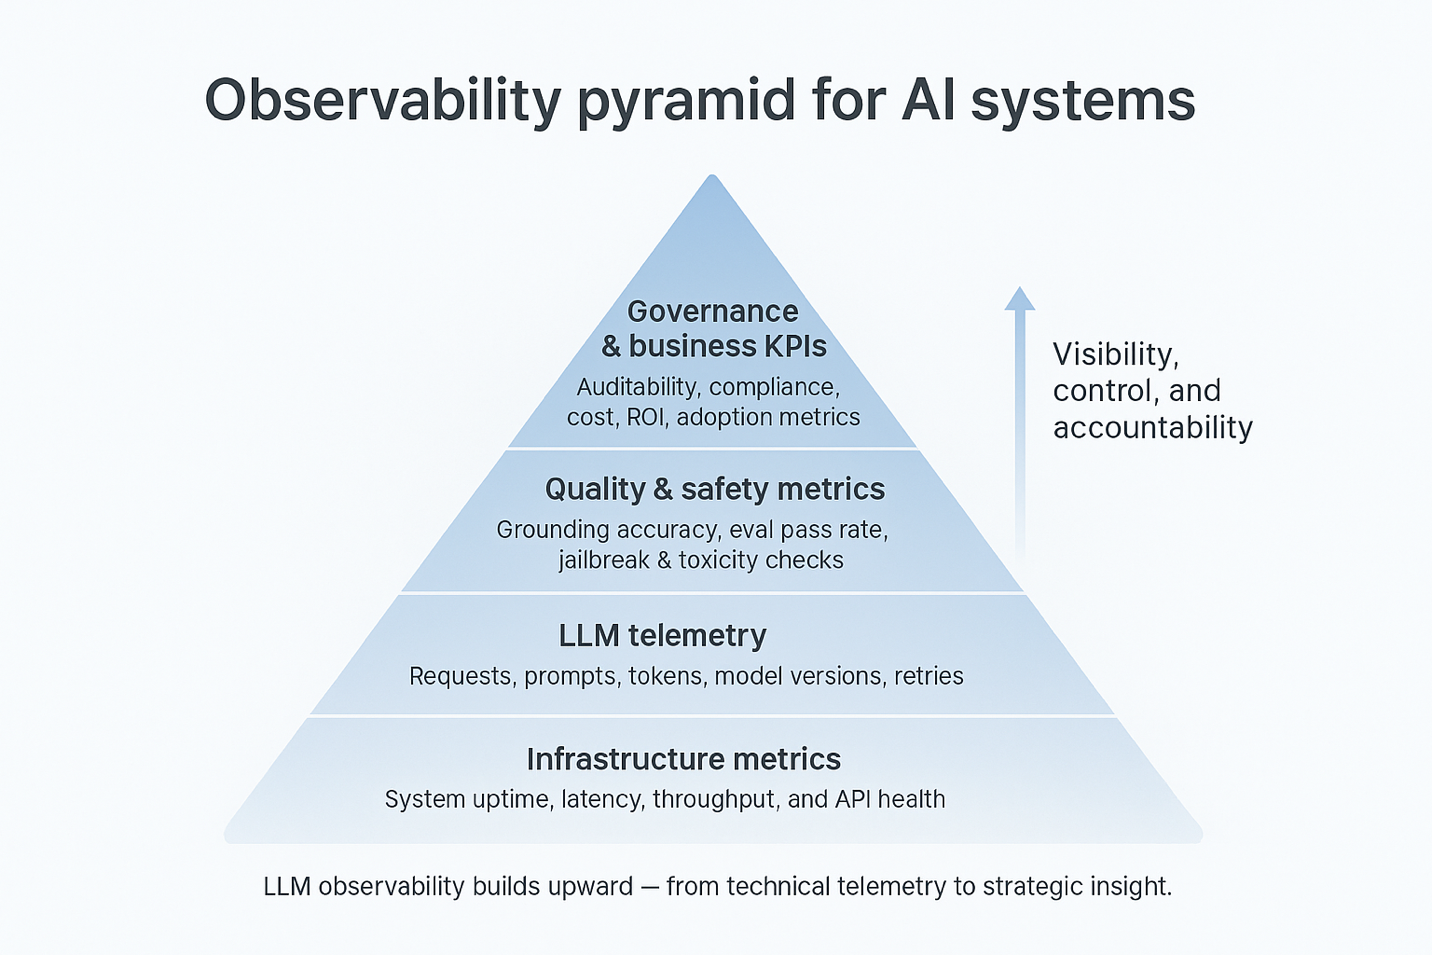
Source: Portkey - The Complete Guide to LLM Observability
The four pillars of agent observability are Traces (full execution paths including LLM calls, tool use, memory reads), Metrics (aggregated time-series for dashboards and alerting), Logs (structured event records for debugging and audit), and Evaluations (automated quality scoring via LLM-as-judge, hallucination detection, and regression tests).
Best Practices
| Key Challenge | Description | Lessons Learned & Alternatives Considered | Solution Applied |
|---|---|---|---|
| Retrofitting observability | Adding monitoring after deployment is costly and incomplete | Considered post-hoc log scraping; found it misses intermediate reasoning steps | Instrument agent architecture from day one using OpenTelemetry-compatible SDKs |
| Trace correlation in multi-agent systems | Requests span multiple agents, tools, and services making debugging hard | Tried per-service logging; couldn't reconstruct full execution paths | Propagate a consistent trace ID through every agent and tool call — it is the only way to correlate logs into a single execution graph; use distributed tracing (Jaeger, Langfuse, Amazon CloudWatch Traces) |
| Multi-agent cost attribution | In multi-agent systems, it is unclear which agent is responsible for the majority of inference costs | Tracked total cost per workflow; couldn't identify which agent to optimize | Use LangFuse token cost tracking across agents — it shows per-agent cost attribution for optimization decisions |
| 100% trace capture cost | Full tracing at production scale is expensive | Evaluated always-on tracing; storage and egress costs were prohibitive | Sample intelligently — 100% of errors, 10–20% of successful requests |
| PII in traces | User inputs logged verbatim expose sensitive data | Considered not logging inputs; lost too much debugging value | Implement PII detection and masking before writing to observability store |
| Token cost visibility | Costs compound silently across sessions and models | Relied on monthly billing reports; caught overruns too late | Track token usage per trace in real time; set budget alerts at 70% and 90% thresholds |
| Local coding-agent trace review | CLI coding agents often write useful traces locally, outside hosted observability stacks | Relied on final answers or raw JSONL logs; missed slow tool calls, retries, and token-heavy sessions | Use local-first trace analyzers such as agenttrace to summarize session cost, latency, tool failures, and health before changes are promoted |
| Hallucination detection | Hard to know when agent outputs are factually wrong | Manual spot-checking doesn't scale | Integrate LLM-as-judge evaluation on sampled outputs; track hallucination rate as a KPI |
| Tool call failure visibility | Tool failures silently degrade agent quality | Checked only final output quality; missed upstream tool errors | Log every tool invocation with input, output, latency, and success/failure status |
| Business metric correlation | Technical metrics don't reflect actual agent value | Tracked only P99 latency; missed that task completion rate was declining | Define business KPIs (task completion rate, escalation rate, resolution rate) and correlate with technical traces |
Trace Fields Reference
Trace operational events, not private hidden reasoning. Each agent run should record:
| Category | Fields |
|---|---|
| Identity | run_id, session_id, user/tenant, model and provider |
| Context | Context size at call, instructions loaded, tools visible |
| Tool activity | Tool calls, tool args (hashed or redacted), permission decisions, approval requests/results, tool result summaries |
| Errors | Errors and retries, compaction boundaries |
| Cost | Token usage (input/output/cached), cost, latency |
| Outcome | Final status, reason for stop |
A trace should answer: - What did the agent try to do? - What data did it use? - What tool changed state? - Who approved it? - What failed? - Why did it stop? - Could the run be replayed?
Trace Grading
After each run, grade specific events: - Did the agent use the right tool? - Was the tool call necessary? - Were arguments valid? - Was permission checked before side effects? - Was approval requested at the right time? - Was the final answer grounded in tool results? - Did compaction preserve the active objective?
Trace grading is the feedback mechanism that turns production observations into harness improvements.
Tooling
| Platform | Open Source | Cost Tracking | Evaluations | Best For |
|---|---|---|---|---|
| Langfuse | ✅ | ✅ | ✅ | Self-hosted, cost-conscious teams |
| Openlit | ✅ | ✅ | ✅ | OpenTelemetry-native stacks |
| LangSmith | ❌ | ✅ | ✅ | LangChain/LangGraph ecosystems |
| Galileo | ❌ | ✅ | ✅ | Multi-agent reliability; Graph/Trace/Timeline views; Insights Engine |
| Braintrust | ❌ | ✅ | ✅ | Regression detection on real user data |
| W&B Weave | ❌ | ✅ | ✅ | Research and experiment-heavy teams |
| AgentOps | ❌ | ✅ | ✅ | Agent-specific monitoring and analytics |
| agenttrace | ✅ | ✅ | ✅ | Local-first AI coding-agent logs and CI regression gates |
Galileo Agent Observability Metrics Framework
From Mastering Multi-Agent Systems (Galileo, 2026), a three-level tracking system for multi-agent production systems:
Three Levels of Tracking
| Level | What It Tracks | Key Metrics |
|---|---|---|
| Session level | Did the agent complete the user's goal? | Action Completion, Action Advancement |
| Step level | Were individual decisions correct? | Tool Selection Quality, Context Adherence |
| System level | What patterns exist across sessions? | Error counts, API latency, token consumption, loop detection |
Production Performance Benchmarks
| Metric | Excellent | Good | Needs Improvement |
|---|---|---|---|
| Action Completion | > 95% | 85–95% | < 80% |
| Tool Selection Quality | > 90% | 85–90% | < 85% |
| Avg Response Time | < 2s | 2–4s | > 4s |
| Supervisor Routing Accuracy | > 95% | 90–95% | < 90% |
Action Completion measures whether agents complete tasks or just acknowledge them. An agent that says "I'll check the bill" scores low. An agent that retrieves the bill, identifies specific charges, and explains them scores high.
Tool Selection Quality measures whether the right tools were chosen with the correct parameters. Two failure patterns: (1) wrong tool selection entirely; (2) correct tool but wrong parameters.
Context Adherence checks if responses used provided context instead of hallucinating.
Continuous Improvement Cycle
| Phase | What It Tracks | Why It Matters |
|---|---|---|
| Monitor | Agent selection, tool invocation, response latency, token usage, inter-agent communication flows | Establishes baseline; reveals bottlenecks and optimization opportunities |
| Debug | Routing errors, tool execution failures, malformed API responses, context loss during handoffs | Enables root cause analysis via complete execution traces |
| Improve | Prompt engineering effectiveness, retrieval accuracy, agent response quality, tool reliability scores | Drives iterative refinement through data-backed decisions |
Monitoring Routine
- Daily: Check 12-hour view to catch overnight regressions
- Weekly: Review weekly view during sprint planning to prioritize fixes by frequency
- Monthly: Validate that improvements actually worked (e.g., revision cycles dropped from 4 to 2 after structured feedback)
Alert Configuration
Key alert types to configure: - Action Completion drops below threshold (e.g., 95% → 85% signals immediate investigation) - Tool Selection Quality below 85% - Average response time exceeds 4s - API failure rate above 0%
Closing the Loop
After applying a fix, monitor the same metric for 24–48 hours. Document each incident: - Symptom: What alert was triggered - Root cause: What investigation revealed - Resolution: What changes were made
These incident records become a reference for troubleshooting and training.
Custom Business Metrics
Beyond standard metrics, define custom metrics that reflect specific business goals. Example: suggested_unlimited_plan — tracks whether agents correctly identify upgrade opportunities for users approaching data limits. An LLM judge (e.g., GPT-4o) evaluates each interaction as Successful / Fail / Unrelated.
Key Metrics Reference
Operational: request volume, response latency (P50/P95/P99), error rate, resource utilization
AI-Specific: token consumption and cost, tool call success rate, context window utilization %, retrieval relevance score (RAG), hallucination detection rate
Business: task completion rate, human escalation rate, user satisfaction score, ROI per interaction
The Observe → Act → Evolve Production Loop (Google AgentOps)
Managing an autonomous agent in production requires a continuous operational cycle rather than static monitoring:
- Observe: Understand the system's behavior in real time via logs, traces, and metrics. This is the sensory system for everything downstream.
- Act: Pull real-time levers to maintain performance, safety, and cost. Think of this as the system's automated reflexes — not strategic improvements.
- Evolve: Use production insights to make the agent fundamentally better. Turn raw observability data into durable improvements in architecture, logic, and behavior.
The critical distinction: "Act" is tactical (circuit breakers, traffic rerouting, HITL escalation); "Evolve" is strategic (prompt refinements, new tools, updated guardrails deployed through the CI/CD pipeline).
Evolution Workflow
Production data becomes the engine of improvement: 1. Analyze production logs for trends — user behavior, task success rates, security incidents 2. Update evaluation datasets — transform production failures into test cases, augmenting the golden dataset 3. Refine and deploy — commit improvements (prompt changes, new tools, guardrail updates) to trigger the automated pipeline
This creates a virtuous cycle where every user interaction is a potential improvement signal. With a mature CI/CD pipeline, the loop from observation to deployed improvement can close in hours or days, not weeks.
Evolving Security via the Production Loop
Security is not a one-time setup. The Observe → Act → Evolve loop applies directly to security posture: 1. Observe: Monitoring detects a new threat vector (e.g., a novel prompt injection technique) 2. Act: Immediate containment via circuit breaker / feature flag to disable the affected capability 3. Evolve: The new attack is added as a permanent test case; Prompt/AI Engineer refines filters or system prompt; change goes through full CI/CD pipeline, validated against the expanded eval set
Every production incident makes the agent's defenses stronger.
Google Cloud Observability Stack
For agents running on Google Cloud (Vertex AI Agent Engine, ADK): - Cloud Trace: Each user request gets a unique trace ID linking Agent Engine invocation, model calls, and tool executions with visible durations - Cloud Logging: Detailed logs for every tool call, error, and decision - Cloud Monitoring: Dashboard alerts when latency thresholds are exceeded - ADK: Built-in Cloud Trace integration for automatic instrumentation of agent operations
AWS Multi-Agent Observability Stack
For multi-agent systems on AWS, a layered approach is required:
| Tool | Role |
|---|---|
| Amazon CloudWatch Traces | Distributed tracing across Lambda, Amazon Bedrock agent invocations, and Step Functions. Renders the full execution graph as a single navigable trace. |
| LangSmith | Purpose-built LLM tracing — hierarchical tree view from orchestrator down to individual tool calls. Evaluation dataset management for per-agent and multi-agent testing. |
| LangFuse | Token cost tracking across agents — shows which agent is responsible for the majority of inference costs. Strong cost attribution for optimization decisions. |
Layered evaluation strategy for multi-agent systems: per-agent evaluations (isolated datasets) + full workflow evaluation (Builtin.GoalSuccessRate) + differential analysis correlating per-agent scores against system-level outcomes.
Monitoring Health: MTTD, MTTR, CFR (Huyen, 2025)
From AI Engineering (Chip Huyen, O'Reilly, 2025), three DevOps-derived metrics provide a clear signal on the health of your observability infrastructure:
| Metric | Definition | What It Reveals |
|---|---|---|
| MTTD (Mean Time to Detection) | Time from failure occurrence to detection | Quality of your alerting and monitoring coverage |
| MTTR (Mean Time to Response) | Time from detection to resolution | Quality of your debugging tools and runbooks |
| CFR (Change Failure Rate) | % of deployments that cause failures requiring rollback | Quality of your pre-deployment evaluation pipeline |
Key principle: Evaluation and monitoring must be tightly coupled. A model that performs well in offline evaluation should also perform well in production. If CFR is high, it is a signal that your evaluation pipeline is not catching issues before deployment — not just a monitoring problem.
Issues detected in monitoring must feed back into the evaluation pipeline as new test cases, closing the quality loop.
See Also
- Observe: Understand the system's behavior in real time via logs, traces, and metrics. This is the sensory system for everything downstream.
- Act: Pull real-time levers to maintain performance, safety, and cost. Think of this as the system's automated reflexes — not strategic improvements.
- Evolve: Use production insights to make the agent fundamentally better. Turn raw observability data into durable improvements in architecture, logic, and behavior.
The critical distinction: "Act" is tactical (circuit breakers, traffic rerouting, HITL escalation); "Evolve" is strategic (prompt refinements, new tools, updated guardrails deployed through the CI/CD pipeline).
Evolution Workflow
Production data becomes the engine of improvement: 1. Analyze production logs for trends — user behavior, task success rates, security incidents 2. Update evaluation datasets — transform production failures into test cases, augmenting the golden dataset 3. Refine and deploy — commit improvements (prompt changes, new tools, guardrail updates) to trigger the automated pipeline
This creates a virtuous cycle where every user interaction is a potential improvement signal. With a mature CI/CD pipeline, the loop from observation to deployed improvement can close in hours or days, not weeks.
Evolving Security via the Production Loop
Security is not a one-time setup. The Observe → Act → Evolve loop applies directly to security posture: 1. Observe: Monitoring detects a new threat vector (e.g., a novel prompt injection technique) 2. Act: Immediate containment via circuit breaker / feature flag to disable the affected capability 3. Evolve: The new attack is added as a permanent test case; Prompt/AI Engineer refines filters or system prompt; change goes through full CI/CD pipeline, validated against the expanded eval set
Every production incident makes the agent's defenses stronger.
Google Cloud Observability Stack
For agents running on Google Cloud (Vertex AI Agent Engine, ADK): - Cloud Trace: Each user request gets a unique trace ID linking Agent Engine invocation, model calls, and tool executions with visible durations - Cloud Logging: Detailed logs for every tool call, error, and decision - Cloud Monitoring: Dashboard alerts when latency thresholds are exceeded - ADK: Built-in Cloud Trace integration for automatic instrumentation of agent operations
Google Cloud Observability Stack
For agents running on Google Cloud (Vertex AI Agent Engine, ADK): - Cloud Trace: Each user request gets a unique trace ID linking Agent Engine invocation, model calls, and tool executions with visible durations - Cloud Logging: Detailed logs for every tool call, error, and decision - Cloud Monitoring: Dashboard alerts when latency thresholds are exceeded - ADK: Built-in Cloud Trace integration for automatic instrumentation of agent operations
AWS Multi-Agent Observability Stack
For multi-agent systems on AWS, a layered approach is required:
| Tool | Role |
|---|---|
| Amazon CloudWatch Traces | Distributed tracing across Lambda, Amazon Bedrock agent invocations, and Step Functions. Renders the full execution graph as a single navigable trace. |
| LangSmith | Purpose-built LLM tracing — hierarchical tree view from orchestrator down to individual tool calls. Evaluation dataset management for per-agent and multi-agent testing. |
| LangFuse | Token cost tracking across agents — shows which agent is responsible for the majority of inference costs. Strong cost attribution for optimization decisions. |
Layered evaluation strategy for multi-agent systems: per-agent evaluations (isolated datasets) + full workflow evaluation (Builtin.GoalSuccessRate) + differential analysis correlating per-agent scores against system-level outcomes.